23 Jan 2020
Abstract
In a magnetic topological insulator, nontrivial band topology conspires with magnetic order to produce exotic states of matter such as quantum anomalous Hall (QAH) insulators and axion insulators. Here, we probe quantum transport in MnBi2Te4 thin flake—a topological insulator with intrinsic magnetic order. In this layered van der Waals crystal, the ferromagnetic layers couple anti-parallel to each other; atomically thin MnBi2Te4, however, becomes ferromagnetic when the sample has an odd number of septuple layers. We observe zero-field QAH effect in a five-septuple-layer specimen at 1.4 Kelvin; an external magnetic field further raises the quantization temperature up to 6.5 Kelvin by aligning all layers ferromagnetically. The results establish MnBi2Te4 as an ideal arena for further exploring various topological phenomena with a spontaneously broken time-reversal symmetry.
[Image]
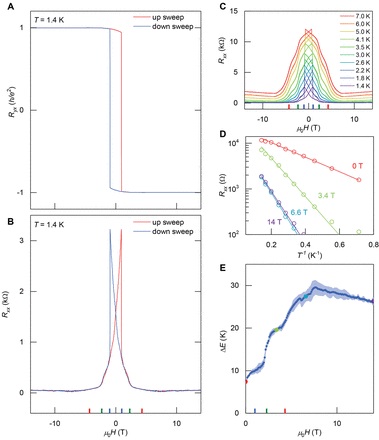
Fig. 2 Quantum anomalous Hall effect in a five-layer MnBi2Te4flake.
(A and B) Magnetic-field-dependent Ryx (A) and Rxx (B) acquired in the five-layer Sample 5b at T = 1.4 K. Ryx and Rxx data shown here are anti-symmetrized and symmetrized, respectively, to remove the mixing of the two components (23). Up and down sweeps of the magnetic field are shown in red and blue, respectively. Ryxreaches 0.97h/e20.97h/e2, concomitant with a Rxx of 0.061h/e20.061h/e2 at μ0H= 0 T. These features are unambiguous evidence of zero-field QAH effect. External magnetic field polarizes the ferromagnetic SLs individually, and further improves the QAH quantization; Ryxquantizes to 0.998h/e20.998h/e2 under magnetic fields above μ0H ~ 2.5 T.
(C) Rxx of Sample 5b as a function of magnetic field acquired at various temperatures. Data are symmetrized to remove Ryxcomponent.
(D) Arrhenius plot of Rxx as a function of 1/T under representative magnetic fields. Solid lines are line fits, the slope of which yields the energy gap of the thermally activated charge transport.
(E) Energy gap as a function of magnetic field extracted from fitting the Arrhenius plots exemplified in D. Shaded region represents the error bound of the energy gap from the line fits. Solid circles highlight the representative gap values obtained from the fittings shown in D. Colored ticks on horizontal axes on panel B, C and E mark the location of magnetic transitions. All data were obtained under a backgate bias of Vg = −200 V.