1 Aug 2019
Abstract
Imaging changes in membrane potential using genetically encoded fluorescent voltage indicators (GEVIs) has great potential for monitoring neuronal activity with high spatial and temporal resolution. Brightness and photostability of fluorescent proteins and rhodopsins have limited the utility of existing GEVIs. We engineered a novel GEVI, “Voltron”, that utilizes bright and photostable synthetic dyes instead of protein-based fluorophores, extending the combined duration of imaging and number of neurons imaged simultaneously by more than tenfold relative to existing GEVIs. We used Voltron for in vivo voltage imaging in mice, zebrafish, and fruit flies. In mouse cortex, Voltron allowed single-trial recording of spikes and subthreshold voltage signals from dozens of neurons simultaneously, over 15 min of continuous imaging. In larval zebrafish, Voltron enabled the precise correlation of spike timing with behavior.
[Image]
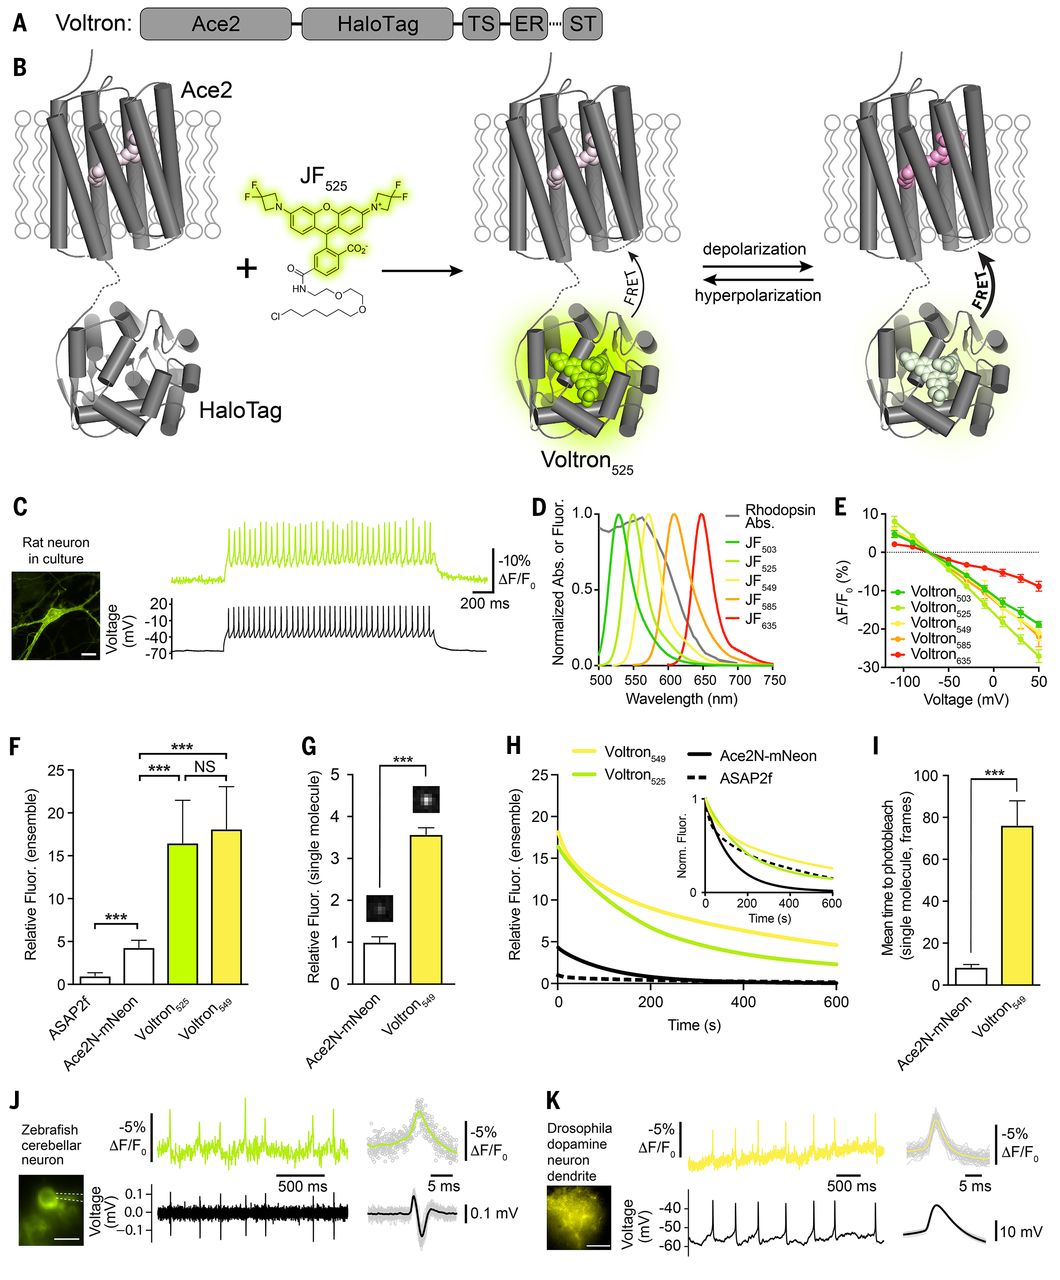
Fig. 1 Development of the chemigenetic voltage indicator Voltron.
(A) Schematic of Voltron sequence: A rhodopsin (Ace2) is fused to a self-labeling tag domain (HaloTag) with additional sequences added to improve or localize membrane targeting: endoplasmic reticulum export sequence (ER), Golgi export trafficking sequence (TS), and somatic targeting sequence (ST).
(B) Model of Voltron mechanism.
(C) Left panel: cultured rat hippocampal neuron expressing Voltron and labeled with JF525. Scale bar: 20 μm. Right panel: single-trial recording of action potentials and subthreshold voltage signals from current injections in primary neuron culture using 400 Hz imaging (top, fluorescence) or electrophysiology (bottom, membrane potential).
(D) Fluorescence emission spectra of different JF dyes overlaid with the absorbance spectrum of Ace2N.
(E) Fluorescence change as a function of membrane voltage with different JF dye-Voltron conjugates.
(F) Relative fluorescence of ASAP2f, Ace2N-mNeon, Voltron525 and Voltron549 in cultured neurons (n = 70, 68, 48 and 62 measurements from five independent transfections for each construct). Illumination intensity ~10 mW/mm2 at imaging plane. ***P < 0.001, one-way analysis of variance (ANOVA) followed by Bonferroni’s test on each pair. Fluorescence was normalized to ASAP2f mean intensity.
(G) Relative single molecule brightness of Ace2N-mNeon and Voltron549. ***P < 0.001, two-tailed Student's t-test.
(H) Bleaching curves for ASAP2f, Ace2N-mNeon, Voltron525, and Voltron549 in primary neuron culture. Illumination intensity ~23 mW/mm2at imaging plane. Bleaching curves were normalized to mean cellular fluorescence from F or normalized to the zero-time value (inset).
(I) Mean time to bleach of Ace2N-mNeon and Voltron549 during single-molecule imaging, 100 ms frames. ***P < 0.001, two-tailed Student's t-test.
(J and K) Simultaneous in vivo Voltron imaging (300 and 800 Hz, top) and electrophysiology (bottom) in larval zebrafish (extracellular) and adult Drosophila (whole-cell), respectively. Spike-triggered averages are shown to the right.