06 Jun 2019
Abstract
Neural circuits emerge through the interplay of genetic programming and activity-dependent process. During the development of mouse olfactory map, axons segregate into distinct glomeruli in an olfactory receptor (OR)-dependent manner. ORs generate a combinatorial code of axon-sorting molecules, whose expression is regulated by neural activity. However, how neural activity induces OR-specific expression patterns of axon-sorting molecules remains unclear. Here we revealed that the temporal patterns of spontaneous neuronal spikes were not spatially-organized, but were correlated with the OR types. Receptor substitution experiments demonstrated that ORs determine spontaneous activity patterns. Moreover, optogenetically differentiated patterns of neuronal activity induced specific expression of the corresponding axon-sorting molecules and regulated axonal segregation. Thus, OR-dependent temporal patterns of spontaneous activity play instructive roles in generating the combinatorial code of axon-sorting molecules during olfactory map formation.
[Image]
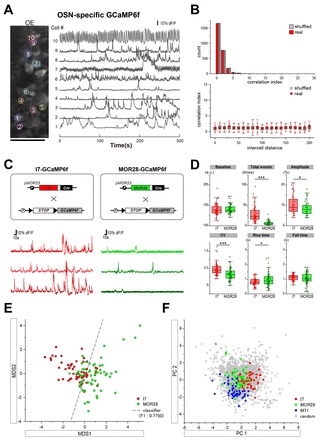
Fig. 2 Spontaneous activity patterns correlate with OR types.
(A) An image of an OE acute slice. OSN calcium transients are shown on the right. Scale bar, 50 μm.
(B) Pair-wise cross-correlation analyses were performed for all possible pairs (N = 2,701 pairs). The distribution of the correlation indices for the real data was not significantly different from that for shuffled data (top, Mann-Whitney U test.). Correlation indices were plotted as a function of the inter-cell distance between cell pairs (bottom). Data are represented as mean ± standard error of the mean (SEM).
(C) H-OR-Cre lines were crossed with Ai95D mice (top). Representative calcium transients are shown (bottom).
(D) Features of spontaneous calcium transients were analyzed for I7- or MOR28-expressing OSNs. Results are shown as box-and-whisker plots displaying the median and interquartile ranges. Outliers are either 1.5 IQR above the third quartile or below the first quartile. CV, coefficient of variation. ***P < 0.001, *P < 0.05, Mann-Whitney U test.
(E) Multi-dimensional scaling (MDS) of the calcium imaging dataset of OR-defined OSNs. The support vector machine (SVM) classifier is shown in a gray line.
(F) PCA biplot of the calcium imaging dataset from 3,214 OSNs.