
18 Nov 2026
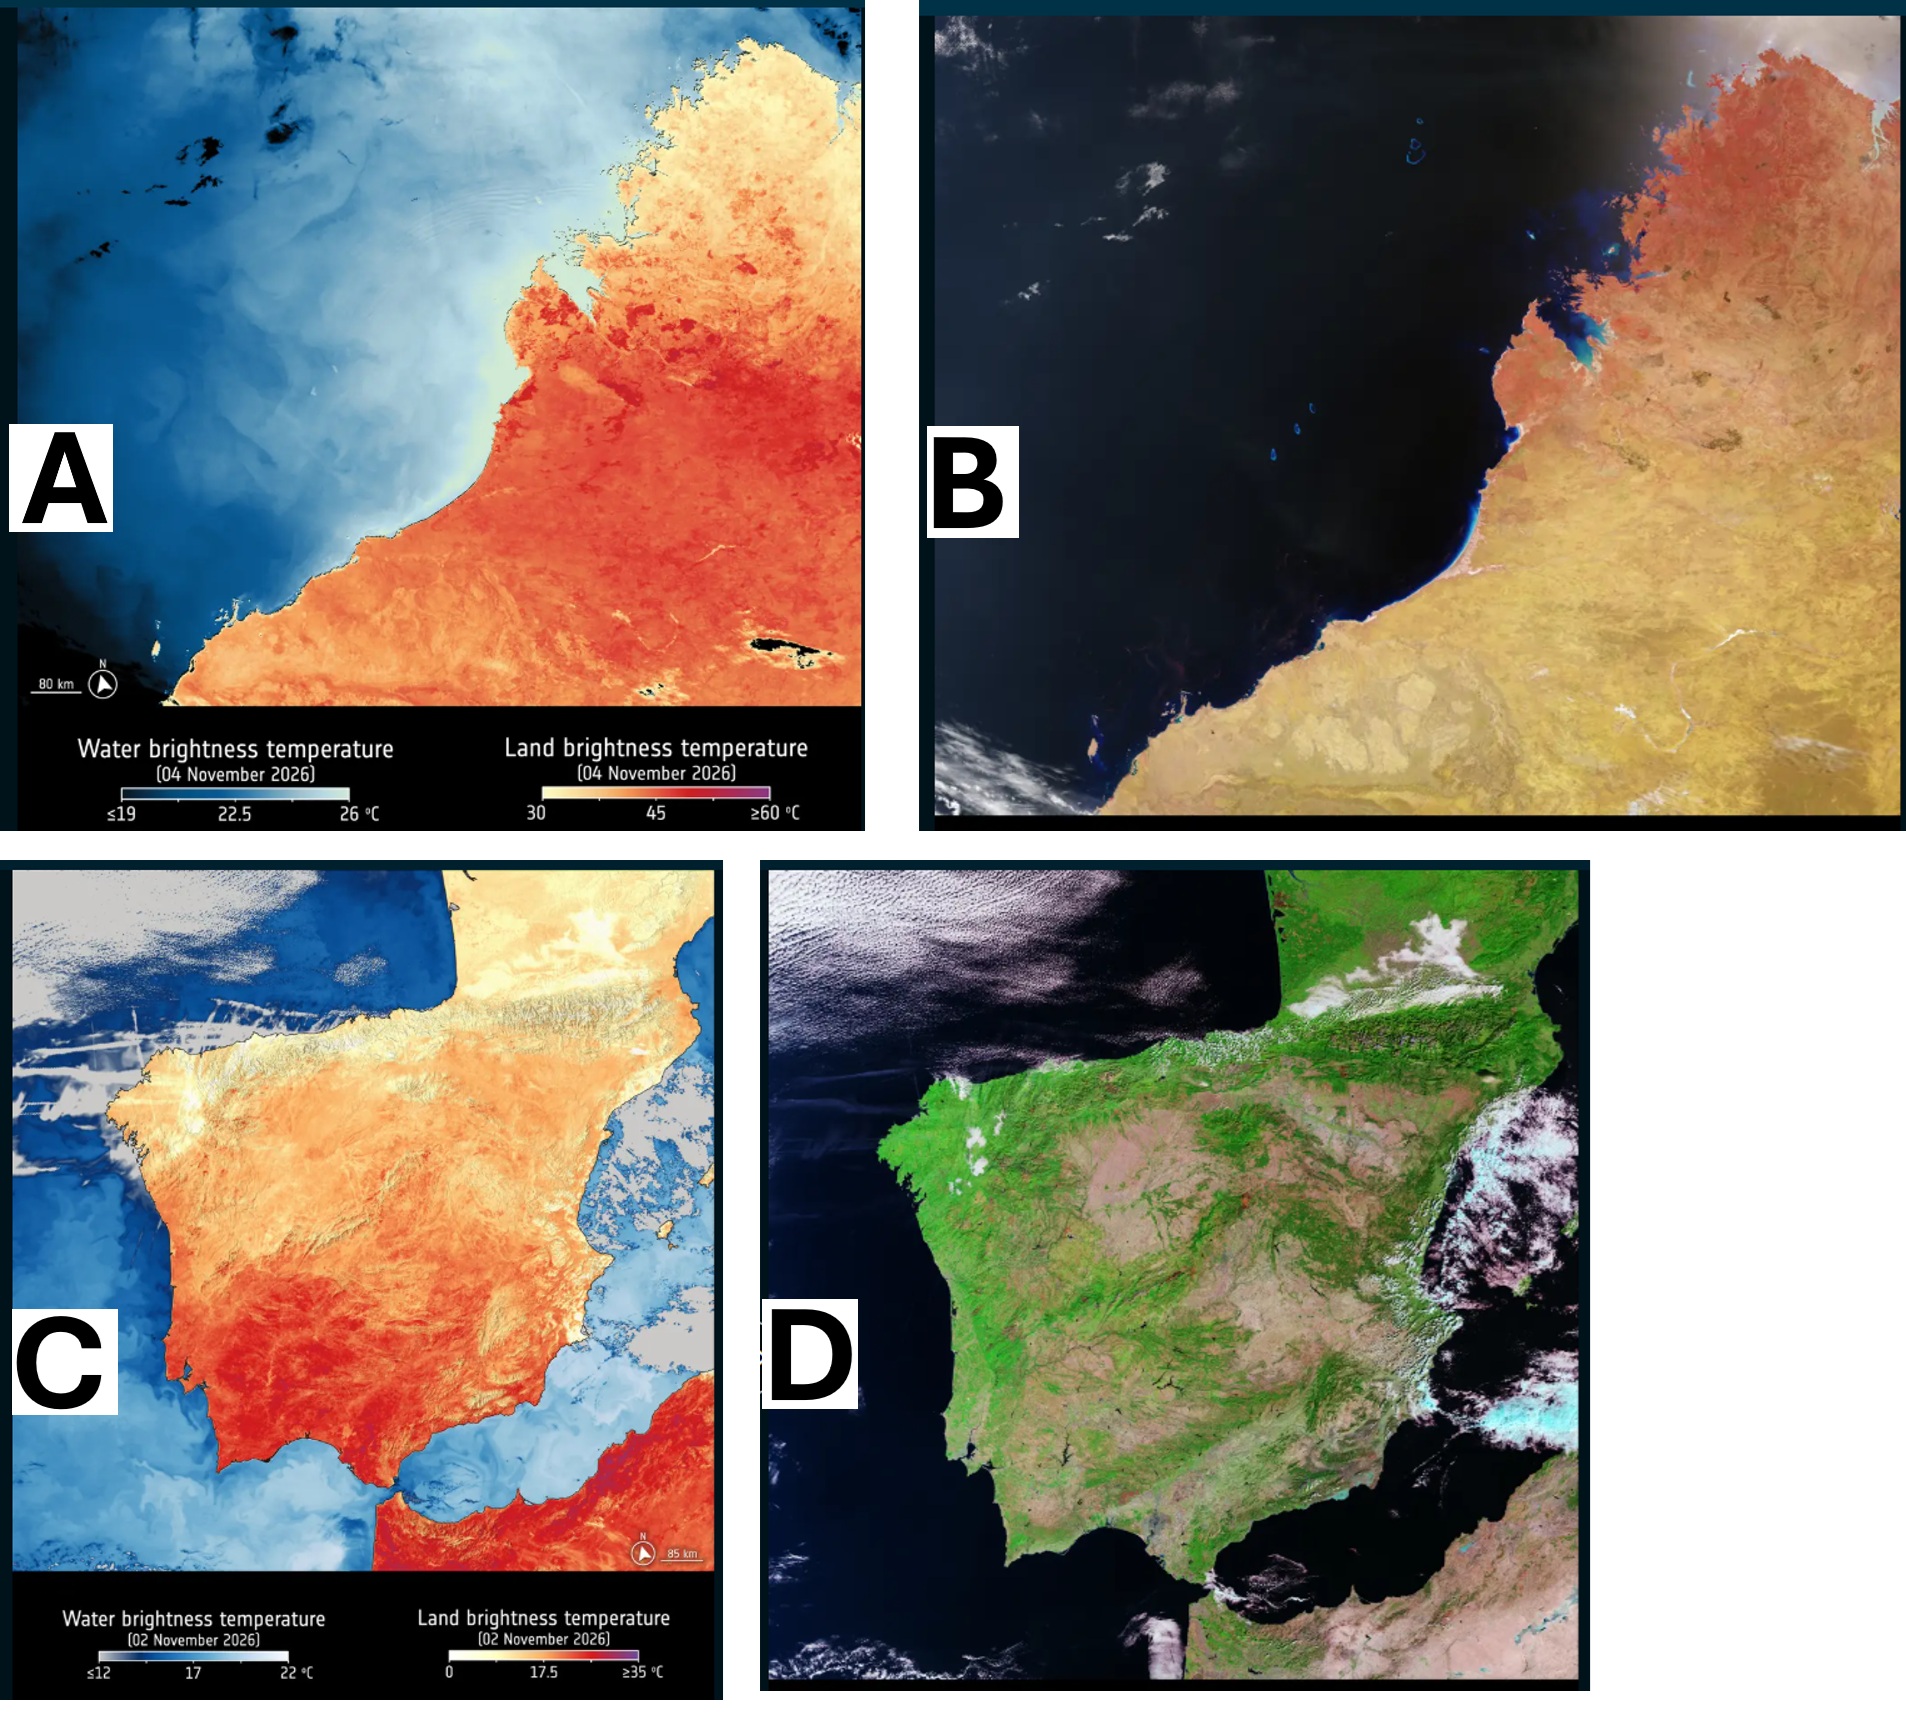
These are the first images showing land- and sea-surface temperatures from the third satellite of the Copernicus Sentinel-3 mission, Sentinel-3C. They show both thermal images and images using the radiometer’s visible and shortwave infrared channels over the land and seas around Western Australia and Spain.
Sentinel-3 systematically measures Earth’s oceans, land, ice and atmosphere, providing data for Copernicus services. The mission’s third satellite was launched on 15 September 2026, carrying four scientific instruments, one of which is the Sea and Land Surface Temperature Radiometer (SLSTR).
This radiometer has nine spectral bands in the visible, shortwave infrared and thermal infrared spectrum. Although the instrument’s primary role is to measure sea- and land-surface temperatures, it also has two dedicated channels for detection and monitoring the intensity of wildfires. While the instrument has already produced an image using its visible light channels, its thermal infrared and shortwave infrared channels have now also been enabled, producing the first images below. These images show that the instrument is working well, even before it has been fully commissioned, which is excellent news.
Above we see the region of Kimberley in Western Australia, which has recently experienced heatwave conditions and wildfires, linked to the El Niño climate cycle, according to Australia’s Bureau of Meteorology. The image shows the town of Broome and the Dampier Peninsula near the centre of the image. Due West of Broome, the Rowley Shoals – three coral atolls – are visible just below the ocean’s surface. This image was captured on 4 November 2026.
In the image on the left, the thermal infrared channel observes brightness temperature, measured at the top of the atmosphere, which corresponds to radiation emitted from Earth’s land and sea surfaces and is inferred using data from one thermal infrared channel of the SLSTR. Brightness temperature may differ from physical temperatures on land or the ocean surface. In the image, temperatures on land exceed 40 ºC in much of the lower part of the image, while parts of the northern coast have temperatures of 35 ºC or less. Temperatures over the eastern Indian Ocean are around 20 ºC.
On the right, we see an image that combines data from visible channels as well as the near infrared channel on Sentinel-3C’s radiometer. It is false-colour, so in this image the red tones on the northern coast of Western Australia denote vegetation growth and density. Burn scars from recent wildfires are also visible in dark brown further inland. Meanwhile, the Rowley Shoals in the Indian Ocean are more visible in this image.
The images of southwestern Europe and part of North Africa above show temperature measurements on 2 November 2026, captured by one of the thermal infrared channels, as well as a false-colour image captured in the visible and shortwave infrared channels. While the visible light spectrum is seen by the human eye, thermal and shortwave infrared are invisible to humans – but they can provide details about soil moisture, plant health, wildfire damage as well as geological mineral composition and gases in the atmosphere.
In the image on the left, southern Portugal and Spain’s Andalusia region have temperatures in the mid to high 20s (ºC), while parts of Morocco and the northern coast of Algeria show temperatures that exceed 30 ºC. As with the image over Western Australia, the brightness temperature is inferred using data from the radiometer’s thermal infrared channel at the top of the atmosphere and it will differ from physical temperatures on land.
Temperatures over the sea are also shown in this image. While there is a contrast in temperature between land and sea around the coasts of North Africa and southern Spain and Portugal, there is less contrast further north. Temperatures on land in northern Spain and France are cooler, as is the surface temperature of the Atlantic Ocean.
In contrast, the image on the right was created using a combination of the visible channel on Sentinel-3C’s radiometer, plus data from its shortwave infrared channel. It’s interesting to note how areas in bright green – a false-colour representation that nonetheless denotes areas of denser vegetation – correspond to the cooler temperatures observed in the image on the left. The shortwave infrared channel has also picked out burn scars, seen in brown, following significant wildfires linked to heatwaves in Europe during summer months – some are visible west of Madrid, Spain, and near Bordeaux, France. These heatwaves are part of a global pattern of more intense and extreme weather, linked to climate change and to the El Niño cycle – precisely the kind of data the Sentinel-3 mission is designed to observe.
Other instruments on board Sentinel-3C have already produced first images. Images from the ocean and land colour instrument (OLCI), and the synthetic aperture radar altimeter were published last month.
[Image]
(A) (B) These are the first images from Sentinel-3C’s radiometer, using the thermal infrared bands to show land and sea-surface brightness temperatures over Western Australia, as well as an image that combines the visible channel with shortwave infrared data.
(C) (D) These Sentinel-3C images of southwestern Europe and part of North Africa show temperature measurements on 2 November 2026, captured by one of the thermal infrared channels, as well as a false-colour image captured in the visible and shortwave infrared channels.